Simple gel documentation with imageJ
draft
This page describes a simple, step by step approach using imageJ to estimate migration distances of samples from a gel electrophoresis run (ie, Gel documentation).
1. Start imageJ (or Fiji)
2. Load the gel image file. Menu: File → Open

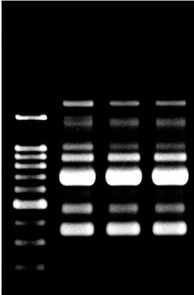
Figure 1. Cropped image of Gel from CDC (03-0219-F1).
3. Invert the image background — make the bands dark against a light background. Menu: Edit → Invert

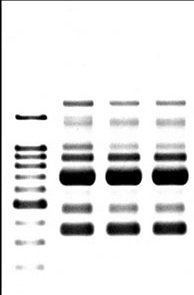
Figure 2. Inverted
4. Set measurement scale, convert number of pixels for a known distance to units of measure, eg, mm, cm.
- Use Straight segmented line tool to draw a line from start to end of the known distance, eg, the width of the gel (OWL B1 mini gels = 90 mm).
- For Fig 2, set the width to 26 mm (it’s a guess from the original image).
- Get the calibration data. Menu: Analyze → Set scale; Set the Global option.
5. Collect migration distances for each band (ladder, sample).

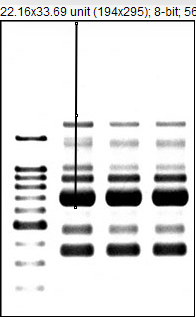
Figure 3. Screenshot of imageJ with line drawn from “well” to band (wells not visible, measure from top of image border).
Draw line from well to band with the line tool (Fig 3), obtain estimated distance by Menu: Analyze → Measure.
Note: Default line drawn is narrow (width = 1) and yellow. In this example I changed to black color and width of 2 (Menu: Edit → Options → Arrow tool, width: 2; color: black). Other option would be to use Menu: Edit → Options → Line width.
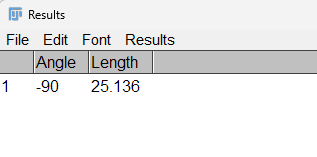
Results displayed in Results window (Fig 4).

Figure 4. Screenshot ImageJ results window
Note: Customize the objects returned by setting options in Menu: Analyze → Set Measurements …
In this example, band #5 in lane 2 travelled a relative distance of 25.136 mm. With a calibration equation calculated from the ladder, numbers of base pairs for the band could be estimated (see Gel documentation).
Resources
Plenty of help out there. Here’s just a couple