Bioinformatics project: Evolutionary analysis of GWAS candidate genes
To do
- Update links
Fix images- Add menu
Our bioinformatics project is a real-world research project, the type done by several research groups around the world. All of the work done is the same that researchers would do; the only difference is that researchers would work with hundreds to thousands of genes or other DNA elements. Instead, our project involves students working with a single gene of their choice; since the course includes dozens of students, work is collated in order to test the main hypothesis.
Background and significance
The goal of human genetics is to identify genetic variants (e.g., SNP), that lead to changes in phenotype. We either begin with phenotype differences, drilling down to see if genetic variation is associated with the differences (top → down), or we start with genetic variation and work our way up to see if the genetic differences are associated with phenotype differences (bottom → up). Note the word “association.” That’s a general way to say correlation; “correlation” is a statistical term with more precise meaning (two variables are linearly associated with each other). Once an association is found between genetic differences and phenotype differences, additional analysis is needed to verify the effect is real (a true positive), and therefore a candidate gene worth studying further, as opposed to a chance association (false positive, probably not worth further investigation).
What kind of genetic variants cause disease? For simple Mendelian traits, an allele (or two alleles if the condition is recessive) at single gene has large effect, resulting in differences in phenotype. This is not the case for multi-factorial, complex disorders. Thus, what kinds of alleles at these numerous genes affect disorders like Type 2 diabetes? Are the alleles found in many individuals in many populations, the common disease – common variant model (Reich & Lander 2001), or are the alleles actually rare in populations, the rare functional variant model (Pritchard & Snow 2002)? After nearly 20 years the answer is neither model describes the relationship well.
Genome Wide Association Studies (GWAS) can be used used to identify candidate genes, but because of the nature of the assay, positive results are consistent, but not sufficient evidence that the genetic differences cause the phenotype differences. Some problems with hybridization-based assays like GWAS include if the target sequence is found in multiple sites of the genome, cross-hybridization with non-target sequences. Additionally, because thousands of sequences are compared simultaneously, the method suffers from what’s known as the multiple comparison problem. In other words, GWAS results in correlations between a disease or condition and a set of genes.
Despite the shortcomings of GWAS, the technique can be used to identify candidate loci (genes) that should be followed up (Visscher et al 2012). There exists a large, public database of studies using the technique, which allows us to call up data and run different analysis to test hypotheses about cause/effect of complex diseases. (The GWAS alternative, and now more popular approach, RNASeq, is to directly sequence all RNAs present in tissues from individuals with and without the condition, also has limitations.) We are all particularly interested in genetic basis of diseases and for those diseases like Type II diabetes which have multifactorial causes, genes of large effect are of particular interest, but challenging to find. Recent advances in sequencing have been coupled with basic surveys of who does and does not have a condition, with the hope that this will identify candidate loci, deserving further analysis.
From a database of conditions and correlations to Single Nucleotide Polymorphisms (SNP), you will investigate from a perspective of frequency of mutation/location as to whether the candidate gene deserves further scrutiny and testing. Thus, instead of a classic experiment, we are taking a bioinformatics approach. Let’s continue to set up the necessary background to understand how this approach can be used to test whether or not the SNP identified is more or less likely to identify genes worth further consideration.
Instead of looking for common or rare alleles, an alternate approach is to look for genetic variants in essential genes to see if alleles at these genes influence complex phenotypes like Type 2 diabetes. Essential genes are those that are essential for survival or reproduction of an organism; in other words, essential genes are expected to be under purifying selection. Because the genes are essential for an organism we would not expect lots of alleles at these genes — functional variants would have reduced survival or reproduction and would tend to be removed from the population. Nonessential genes, on the other hand, are expected to have more variation and be less subject to natural selection, i.e., change expected to be more due to chance (genetic drift). This is an overly simplistic view, as it ignores linkage, i.e., differences associated with an SNP are not due to the SNP itself, but because the SNP is close to a DNA element that is causally related. However, it does provide us a way to take advantage of the comparative method. While studies have looked at the potential relationship between essential genes and diseases by comparing orthologous sequences in mice (e.g., Dickerson et al 2011), we are extending this approach to include other species. We can identify essential genes by comparing variation among different species and plotting genetic variation against divergence time, the time since species last shared common ancestors. Essential genes are conserved over evolutionary time and the slope of the association between genetic variation and divergence time will be smaller than the slope for nonessential genes since divergence.
What you will do
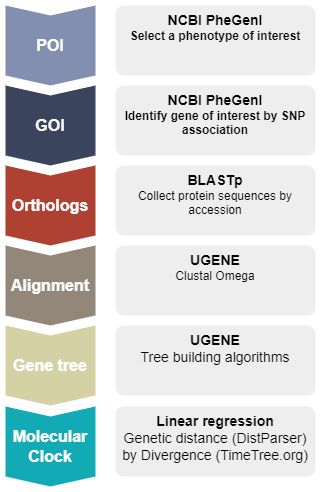 The project is divided into several interconnected modules or briefs. Project begins by selecting a phenotype of interest (POI) and a genotype of interest (GOI) from the Genome Wide Association Studies (GWAS) database (NCBI PheGenI). Once the GOI is selected, identify accession number for the human protein product, then collect by BLAST search putative ortholog sequences for an additional thirteen animal species, three reptile and one marsupial species as outgroups, and ten placental mammal species, including human, as the ingroup.
The sequences are imported into a genome workbench software called UGENE, which is used to align the sequences so that homologous comparisons may be made to construct gene trees by Neighbor Joining, Bayesian, and Maximum likelihood algorithms.
This work constitutes the data collection phase of the project. Once the gene trees are made, the next steps involve calculating the pairwise genetic distances among the fourteen species, then fitting the linear regression of genetic distance by divergence time. Slope from the regression is the estimate of the Molecular Clock for that gene. While this approach is not state-of-the art, it allows the student to focus on use of model to test evolutionary hypotheses as a first step approach. Pairwise genetic distance, although an intuitive measure of change, likely underestimates magnitude of evolutionary change (Bromham and Penny 2003); therefore, substitution models are also introduced . Moreover, linear regression is no longer an appropriate approach because of the obvious lack of independence given the nested, hierarchical association, i.e., autocorrelation, among the taxa. One approach is to apply phylogenetic independent contrasts (Drummond et al 2003).
Given an estimate of rates of evolution for a gene, rapid rates of evolution (steep slope) suggests lack of purifying selection, consistent with the view that unconserved genes are nonessential genes; in contrast, slow rates of evolution (shallow slope) suggests purifying evolution, consistent with the view that conserved genes are essential genes. The Molecular Clock model is a null hypothesis for sequence evolution; like all models it comes with assumptions. Consistent with best scientific practice, we test the assumption that rates of evolution are equal throughout the gene tree, a key assumption of the Molecular Clock model, by Tajima’s rate test and tree reconciliation. To the extent the assumption is met, our confidence in the use of the Molecular Clock increases.
We conclude the project by revisiting the original question: a GOI was associated with differences in phenotype state. If an SNP was in an essential genes, we would infer the association likely important, perhaps causal in determining the difference in phenotype.
In other words, the project applies an evolutionary perspective to whether or not observed variation in the form of statistically significant associations between SNP and phenotype differences are likely important or not. The evolutionary approach is supplemented by obtaining additional information about the GOI, including whether or not it is part of a gene family, total number of SNP, etc.
Students develop several bioinformatics and data science skills from the project, from project management to creating and updating with files in different file formats. Students also gain experience working with software used by bioinformatics community, including BLAST, sequence alignment algorithms like CLUSTAL Omega and MUSCLE, and phylogenetic tree building software which implement specialized approaches to constructing genes trees (Neighbor Joining, Bayesian, Maximum Likelihood). Assessment of skills and concepts learned is done by quiz (multiple choice and short answer questions). The culmination of the project is a report, delivered by presentation and recorded as video. Students conduct peer-evaluation of reports to complete the work done.
What to turn in = Report
This project will take several weeks to complete, with multiple exercises ranging from identifying candidate genes for study to working with a genome workbench tool. You will gain experience with handling large data sets, collecting sequences from remote databases, aligning sequences, constructing and evaluating gene trees, and testing your sequence for a molecular clock (= neutral change). These techniques, and the background necessary to understand what you are doing, are presented each week as we progress through the semester.
I suggest due dates for the parts of the report (we’ll call them briefs), to help you keep on track, but ultimately, your grade for Report 2 is based on the Final Report, due at the end of the semester Submit Report slide show
You will be asked to construct pdf files from PowerPoints for each of the Briefs listed in the Workflow, culminating at the end with a single, updated PowerPoint (again, pdf format) to complete Report.
Work is turned in to CANVAS as assignments. Submit Report slide show
About filenames
You will be sharing many files with me. Please stop and think about how you name files. For a reminder, see Please create good file names.
Notebook and metadata
Remember — I am expecting you to keep notes, documenting all that you do. Pay attention particularly to decisions you make. All of this belongs in your digital notebook, along with the typical notebook items. For each step in the project identify in your notebook
- Purpose
- What are the questions/hypotheses being tested?
- What tools and resources used
- Protocol and method notes
- Results
- Analysis
References
Alhuzimi, E., Leal, L. G., Sternberg, M. J., & David, A. (2018). Properties of human genes guided by their enrichment in rare and common variants. Human mutation, 39(3), 365-370. link
Blekhman, R., Man, O., Herrmann, L., Boyko, A. R., Indap, A., Kosiol, C., … & Przeworski, M. (2008). Natural selection on genes that underlie human disease susceptibility. Current biology, 18(12), 883-889.
Bromham, L., & Penny, D. (2003). The modern molecular clock. Nature Reviews Genetics, 4(3), 216-224.
Dickerson, J. E., Zhu, A., Robertson, D. L., & Hentges, K. E. (2011). Defining the role of essential genes in human disease. PloS one, 6(11). link
Drummond, A., Pybus, O. G., & Rambaut, A. (2003). Inference of viral evolutionary rates from molecular sequences. Adv Parasitol, 54, 331-358.
Goldstein, D. B., Allen, A., Keebler, J., Margulies, E. H., Petrou, S., Petrovski, S., & Sunyaev, S. (2013). Sequencing studies in human genetics: design and interpretation. Nature Reviews Genetics, 14(7), 460. link
Kachroo, A. H., Laurent, J. M., Yellman, C. M., Meyer, A. G., Wilke, C. O., & Marcotte, E. M. (2015). Systematic humanization of yeast genes reveals conserved functions and genetic modularity. Science, 348(6237), 921-925.
Pritchard, J. K., & Cox, N. J. (2002). The allelic architecture of human disease genes: common disease–common variant… or not?. Human molecular genetics, 11(20), 2417-2423. link
Reich, D. E., & Lander, E. S. (2001). On the allelic spectrum of human disease. TRENDS in Genetics, 17(9), 502-510. link to pdf
Schork, N. J., Murray, S. S., Frazer, K. A., & Topol, E. J. (2009). Common vs. rare allele hypotheses for complex diseases. Current opinion in genetics & development, 19(3), 212-219. link
Visscher, P. M., Brown, M. A., McCarthy, M. I., & Yang, J. (2012). Five years of GWAS discovery. The American Journal of Human Genetics, 90(1), 7-24. link
Wang, T., Birsoy, K., Hughes, N. W., Krupczak, K. M., Post, Y., Wei, J. J., … & Sabatini, D. M. (2015). Identification and characterization of essential genes in the human genome. Science, 350(6264), 1096-1101.
Zhang, L., & Li, W. H. (2004). Mammalian housekeeping genes evolve more slowly than tissue-specific genes. Molecular biology and evolution, 21(2), 236-239.
Zhang, Z., & Ren, Q. (2015). Why are essential genes essential?-The essentiality of Saccharomyces genes. Microbial Cell, 2(8), 280.
/MD