Phylogenetics
Sections in this chapter include:
Phylogenetics
Background
In its most basic form, evolution is simply genetic change over time (generations). The processes of evolution that generate differences begin with mutation (inherited change of DNA sequence) and the fate over time of that mutation. The change observed in an individual may increase (the individual leaves lots of offspring), or decrease (the individual has few or no offspring). If the mutation itself contributes somehow to the individual having more (or fewer) offspring, then this represents change because of natural selection and the new mutation would increase (decrease) in the population. On the other hand, if the new mutation contributes not at all to whether or not the individual has offspring (the change is “neutral with respect to fitness”), then whether the new copy increases or decreases in the population over time is simply the result of chance (called genetic drift).
A fundamental observation about the diversity of life on the planet is that related species share many features, and the more distant in time since two species last shared a common ancestor (divergence), then the number of shared features between them also decreases (See Wikipedia for a summary).
In constructing phylogenies from biological sequences – nucleic acids (DNA & RNA), proteins – for a variety of reasons, we prefer to use genetic changes that are neutral or nearly so with respect to fitness (fitness is very loosely defined as the number of offspring an individual leaves to the next generation).
Work flow
The basic workflow of a phylogenetic analysis begins with a target sample of species or other taxonomic units for which phylogenetic hypotheses are needed, collect representative biological sequences, conduct multiple sequence alignment, then select and employ a tree-building approach based on a model of evolution. Phylogenetic analyses are done with a variety of computer algorithms: BLAST to collect sequences, Clustal Omega – or other multiple sequence alignment (MSA) programs, and tree-building programs (PHYLIP Neighbor Joining, IQ-TREE, mrBayes, PhyML). Each of the software accomplish some but not all of the tasks needed to complete phylogenetic analysis. On the plus side, most of the software are freely available, and some (PHYLIP), have been around for many years. For the beginner, the down side is that multiple file types, file input formatting, and outfiles are generated by the programs, which requires the user to work within several different user interfaces. We use Unipro UGENE (Okonechnikov et al 2012), which provides a graphical user interface (GUI) that handles file input and output across the workflow. MEGAX is another GUI for conducting MSA, tree-building, and evolutionary analyses (Tamura et al 2021). And packages are available for the R statistical programming language (Toparslan et al 2020).
Tree thinking
A phylogeny network, or “tree,” is a representation of “who is related to whom;” it is the study of evolutionary relatedness among groups of organisms. One way to think about evolution is that it is inherently a branching process. You are already familiar with this type of network to show relationships. Brothers, sisters, parents, aunts, uncles, cousins (first, second), grandparents, great uncles, etc. — we show this as a pedigree or “family tree.” Think of a phylogeny as an extended pedigree; a phylogenetic tree graphic for species is Darwin’s descent with modification from common ancestors (Baum et al 2005). An individual is at the tip of the branch (node), connected to other individuals by membership in families, with families connected to other families by membership in populations, and so on to the level of species, and to even higher taxonomic levels. In graph theory, connections between branches are called nodes; branches are called edges.
Branch length refers to the height or length between two nodes in an ordered tree (e.g., a phylogenetic tree). More properly in graph theory branches are called edges. In the case of gene trees the branch length between an ancestor and its descendent taxa is proportional to the rate of evolution (r, mutation and fixation rate) multiplied by the time (T) since divergence.
Branch lengths can be shown to be equal to the average number of substitutions per site of the protein or nucleotide sequence. Between two taxa then the number of expected substitutions can be obtained by the equation
![]()
where Kx,y is the number of substitutions between taxa x and taxa y. (This equation is obviously a simplification; more sophistic and realistic models are available in the phylogeny software.)
If working with protein sequences, branch lengths can be converted to number of amino acids substituted by the equation
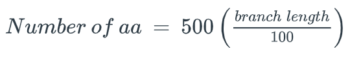
Figure 1 depicts a “tree” linking five groups. If the groups are families of humans, then we would interpret the branching order in terms of relationships. B and C are related to each other, D and E are related to each other, and both B,C and D,E are more closely related to each other than they are to family A. If this is a tree of species, then we would say that B,C shared a common ancestor more recently and D,E shared a recent common ancestor, and that the two groups (B,C and D,E) shared a common ancestor recently in contrast to their genetic relationship to A.
In general, the horizontal spread of the drawn tree is done for convenience, it has no meaning. In the case of the tree drawn in Figure 1, the vertical spread also has no meaning. If however a distance measure is used, the length of the branches can be used to the amount of difference or divergence between each of the nodes and branch tips. times (i.e., how long ago two species shared a common ancestor) are provided at the base of each branch. Assumptions must be made to provide actual time (e.g., millions of years).
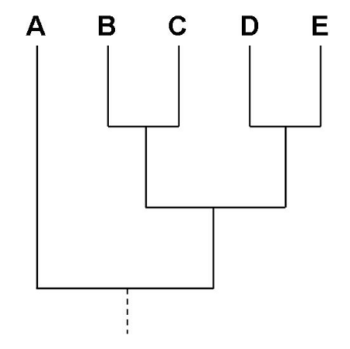
Figure 1. A graph tree depicting relationships among five taxa. Display is called a rectangular cladogram.
Data files are just text
Phylogeny software, like UGENE, write trees with brackets, commas, and text, according to agreed upon formats (for help with working with text files, see Text files are data files).
A simple format is referred to as the Newick format. The Newick data for the tree in Figure 1 is simply
((B,C),(D,E),A);
You can copy/paste the code into UGENE and view the tree, or try any number of tree viewing programs, some online. UGENE is now a decent app for viewing and making simple changes to the tree. However, there are better tree apps. The statistical programming language R is good at working with gene and phylogenetic trees. An excellent installed tree viewer is FigTree. R, the statistical programming language (R Core Team 2022), also can read and display Newick and other tree formats with the ape package (Paradis and Schliep 2019; additional packages listed in Toparslan et al 2020). For a quick online view of your file, try IcyTree (Vaughan 2017). To display a tree like the one in Figure 1 at IcyTree, select
File → Enter tree directly…
(or simply press the “e” on your keyboard!), and then paste the Newick string into the window. Click “Done” (Fig. 2) to draw your tree.
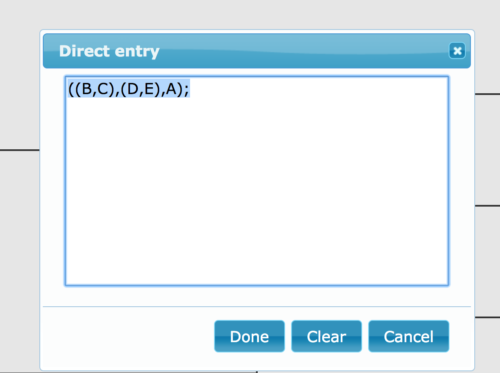
Figure 2. Screenshot of direct entry of Newick string at icytree.org
You should try editing this simple Newick string and see how the tree topology is represented by brackets. For example, what does
(B,(C,D,E),A);
look like? Don’t forget to include the outer brackets plus end the string with the semicolon.
An additional online tree viewer is iTOL: Interactive Tree of Life (Letunic and Bork 2021).
References
Baum, D. A., Smith, S. D., & Donovan, S. S. (2005). The tree-thinking challenge. Science, 310(5750), 979-980.
Letunic, I., & Bork, P. (2021). Interactive Tree Of Life (iTOL) v5: an online tool for phylogenetic tree display and annotation. Nucleic acids research, 49(W1), W293-W296.
Okonechnikov K, Golosova O, Fursov M, the UGENE team. Unipro UGENE: a unified bioinformatics toolkit . Bioinformatics 2012 28: 1166-1167. doi:10.1093/bioinformatics/bts091
Paradis E, Schliep K (2019). “ape 5.0: an environment for modern phylogenetics and evolutionary analyses in R.” Bioinformatics, 35, 526-528.
R Core Team (2022). R: A language and environment for statistical
computing. R Foundation for Statistical Computing, Vienna,
Austria. URL https://www.R-project.org/.
Tamura K, Stecher G, Sudhir Kumar S (2021) MEGA11: Molecular Evolutionary Genetics Analysis version 11. Molecular Biology and Evolution 38:3022-3027
Toparslan, E., Karabag, K., & Bilge, U. (2020). A workflow with R: Phylogenetic analyses and visualizations using mitochondrial cytochrome b gene sequences. PloS one, 15(12), e0243927.
Vaughan, T. G. (2017). IcyTree: rapid browser-based visualization for phylogenetic trees and networks. Bioinformatics, 33(15), 2392-2394.