How to get the distances from a distance tree
Draft
to do
- Fix links
- Update information
Work with your best tree, your maximum likelihood gene tree.
To do
Extract the patristic distance, the sum of the branch lengths that link two nodes in a tree, for each pair pf species.
Overview
We need to extract the pairwise patristic distances from your gene tree for all 14 taxa. This information, together with the divergence times (Pairwise divergence times), forms the data for calculating the molecular clock (Molecular Clock). The X variable is the divergence times, the Y-variable are the distances.
Background & Example
Hamming distance — the distance measure used by UGENE — is the proportion (p) of amino acid (or nucleotide for DNA or RNA) sites at which the two sequences to be compared are different. It is obtained by dividing the number of amino acid differences by the total number of sites compared. It does not make any correction for multiple substitutions at the same site or differences in evolutionary rates among sites. On a gene tree, distances are the lengths of the branches connecting the taxa,
We want to know how different are two species for the given protein? That’s the distance between them in proportion of amino acid sites that are different by total number compared.
A distance tree has been obtained. An example is shown below, Figure 1.
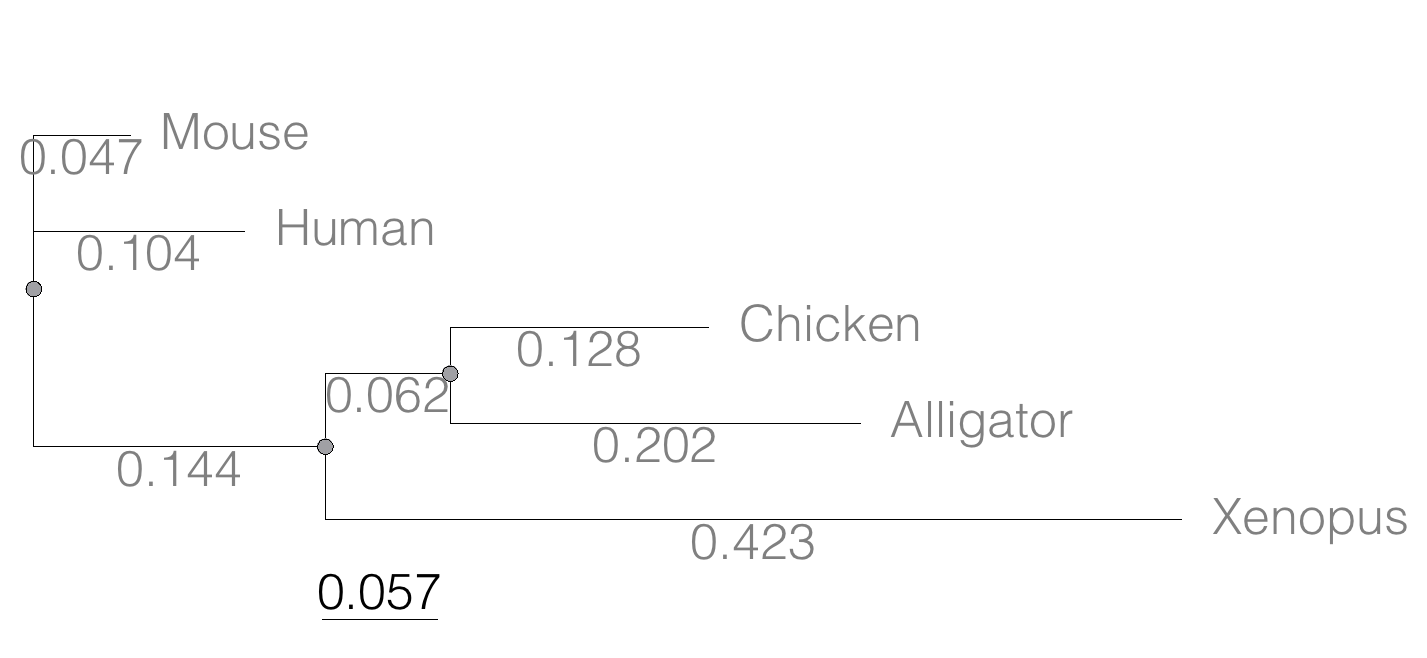
Figure 1. A mid-rooted “gene tree” of the product (protein HBA1) with five taxa.
Here’s the Newick format for the tree
(Mouse:0.0474516,Human:0.104063,((Chicken:0.127652,Alligator:0.202421):0.0616593,Xenopus:0.422801):0.143939);
Copy and paste (don’t drag and drop) the Newick code to your text editor (macOS: TextEdit; WinPC: Notepad), or you can download the file 5Spp_HBA1.
You can view the tree in UGENE (save file to your Working folder, in UGENE, File → Open) or online. Tree viewers I recommend include iTOL, ATGC:PRESTO and icytree.org.
Distances are additive
To get the total distance between leaves (tips), add the branch lengths. For example, between Mouse and Human, the distance is 0.047 + 0.104 = 0.151. Repeat then for each pairwise comparisons.
Now, if you only have a few taxa, this is not too hard to do by hand. But, as the number of taxa increases, the number of pairwise comparisons increases rapidly.
To get the number of pairwise comparisons, C, let k = number of taxa, then
(1) 
For the tree above, k was five, therefore C was ten pairwise comparisons.
Question 1. How many pairwise comparisons are there for 14 (14) taxa?
If you are like me, you want to find a solution so you don’t have to do this by hand
Often, someone has already provided an app to solve your bioinformatics problems. Just as often, however, these often free resources come and go for lack of funding support, or, continued interest of the creator. Thus, even casual bioinformatics users need to be able to adapt. However, an even better solution is to realize that I am just introducing you to bare-bones bioinformatics at this point and to embrace the next step — learning how to solve problems — with your own code — yourself. For example, we use UGENE in my courses; it’s a workstation and helpful to work with sequences. It is not. however, good package for doing phylogeny work — that’s not it’s purpose! MEGA is a good package for this, but alternatively, you could go with what the professionals do — they use the R statistical language (as one of many options). R has the advantage that you’ll need it in a variety of your Biology (and Data Science) courses, and the code to solve your bioinformatics problem is already available. Such is the case for us — we will show you how to extract patristic distances from Newick trees using R.
I will present a simple script for use with the R statistical programming language. In addition to access to R, you’ll need the package ape (Analyses of Phylogenetics and Evolution) installed and running.
First, decide if you wish to run R on your own computer — highly recommended! — or prefer to run in the cloud. Instructions for both routes are provided at Mike’s Biostatistics Book. The direct link to R-project is https://r-project.org.
Extract distances from Newick tree file with R and the ape package
Always begin your coding project by writing out the purpose statement and outline steps the code needs to accomplish. Thus, We’re going to use the cophenetic() command in ape package to extract distances among all pairwise comparisons for the k taxa, and, report the results in alphabetically sorted table format suitable to wither write to a text file or simply copy/paste into a spreadsheet.
You can use the basic tools in R to work with matrices, too, so, for example our distance matrix we export from UGENE could be imported into R then converted into the pairwise columns we need to complete our molecular clock calculations. Again, we’re looking to find a good way to get our answers, so we look to R packages. A number of packages in R are available to work with phylogeny and sequences. We will use the “ape” package along with basic code available in the base installation of R.
The code assumes you have installed R onto your computer, which will result in pairwise distances properly sorted and saved to your working folder for import into your Molecular Clock data set file. If not, you can run R in your browser at rdrr.io, or even within this page. For your own analysis, you need to update the Newick code with your own before creating myTree. From your text editor, copy all of your code and replace the R code where you see text=” “. All text preceded by “#” are comments and are not run by R. Here’s the script in R. Don’t type the >, that’s the R prompt. Type everything after the > exactly as written.
The script
Stop. Is the ape package for R installed on your computer? If so, proceed. If not, install the package first. The ape package must be installed on your computer prior to running the script. See Mike’s Biostatistics Book for tips how to download and install R packages.
Note. No need to install any package if you run R script in your browser via rdrr.io.
The following code involves a function, getDis, to do the work. It generates a data frame with the distance results that you should be able to copy and insert into your spreadsheet app.
The user needs to provide the tree and the sorted list of taxa. There’s no error checking done by the script (!!), so user must provide accurate inputs. A common error is to enter taxa incorrectly: “alligator” instead of “Alligator,” for example. The list of taxa names must match the taxa included in the Newick file.
The code follows — the example runs our five taxa example tree. For actual use, user needs to
- Replace the Newick tree (see object
myTreecreated withread.treeinput) with the actual newick code.
Here’s the script. Note that any line beginning with # is interpreted by R as comment, not code.
Start R, point it to your working directory
- macOS R GUI: Menu: Misc → Change Working Directory…
- Windows PC R GUI: Menu: File → Change dir…
Create a script document in R
- macOS R GUI: File → New Document
- Windows PC R GUI: File → New script
then copy and paste the function and
getDis <- function(tree) {
  myTree <- cophenetic(tree)
  all.tips <- sort(tree$tip.label)
  myTree <- myTree[,all.tips]
    xy <- t(combn(colnames(myTree), 2))
    xy <- xy[order(xy[,1]),]
  myOut <- data.frame(xy, myTree[xy])
  colnames(myOut) <- c("Spp1", "Spp2", "Distance")
  return(myOut)
}
#to run the function, highlight and submit the code to R. Then, submit your gene tree
myTree <- ape::read.tree(text="
(Mouse:0.0474516, Human:0.104063, ((Chicken:0.127652, Alligator:0.202421):0.0616593, Xenopus:0.422801):0.143939);
")
# And last, call the function
myDis <- getDis(myTree); myDis
Results are stored in the object myDis and will be displayed on the screen for you to copy/paste. See Option
For your own tree, you need to make one change to the code.
1. Find the line in the code that reads
myTree <- ape::read.tree(text="
and copy/paste your Newick file there to replace the example file. Note that the end of the code line includes “)
Should work!
Run the code
With the code into your script document, you just need to run — submit — the code to R and monitor the output (results).
To run script in R, point the browser to the first line then select the entire code you wish to run. Use the keyboard to submit the command(s)
- macOS: Command + Enter
- Windows PC : Ctrl + r
Common errors running the code
Error in getDis(myTree, all.tips) : could not find function "getDis"
Interpretation: the function getDis was not created first.
> myTree <- ape::read.tree(text="
+ (Mouse:0.0474516, Human:0.104063, ((Chicken:0.127652, Alligator:0.202421):0.0616593, Xenopus:0.422801):0.143939);
+
Interpretation: the end ") is missing — note the + at the end of the line? That means R is waiting for more code. that the full command is read.tree(text="[insert code]"), and we replace [insert code] with our Newick code.
Error in ape::read.tree(text = "\n(Mouse:0.0474516, Human:0.104063, ((Chicken:0.127652, Alligator:0.202421):0.0616593, Xenopus:0.422801):0.143939);\n") :
could not find function "read.tree"
Interpretation: the ape package was not downloaded & installed first.
Improve output for copy/paste
After myDis is created, you can copy the data from R output to Google Sheets (or whichever app you prefer). To improve the copy/paste, a little formatting of R output is in order. Add and run the following line of code.
print.data.frame(myDis, row.names=FALSE, right=FALSE)
Now, instead of
        Spp1    Spp2  Distance
1  Alligator Chicken 0.3300730
2  Alligator   Human 0.5120823
3  Alligator   Mouse 0.4554709
4  Alligator Xenopus 0.6868813
5    Chicken   Human 0.4373133
6    Chicken   Mouse 0.3807019
7    Chicken Xenopus 0.6121123
8      Human   Mouse 0.1515146
9      Human Xenopus 0.6708030
10     Mouse Xenopus 0.6141916
You’ll get
 Spp1      Spp2    Distance
 Alligator Chicken 0.3300730
 Alligator Human   0.5120823
 Alligator Mouse   0.4554709
 Alligator Xenopus 0.6868813
 Chicken   Human   0.4373133
 Chicken   Mouse   0.3807019
 Chicken   Xenopus 0.6121123
 Human     Mouse   0.1515146
 Human     Xenopus 0.6708030
 Mouse     Xenopus 0.6141916
Tips to copy paste into Google Sheets
To paste text into separate columns in Google Sheets, paste the text into the spreadsheet, then select the cells containing the text. Next, go to “Data”, then “Split text to columns”, and choose the delimiter (like comma, space, etc.) to separate the data. If copying text from the clipboard you should see a little clipboard icon popup at lower right of the highlighted text. You can access the menu to manage paste into columns from there.
Optional — write the results to a text file
If R is installed locally, then use the following code to create a file you can import into your spreadsheet file, avoiding the copy/paste routine.
#if local installation of R, then save output to text file for import to spreadsheet
write.csv(odist_myMatrix,"odist_myMatrix.csv")
The write.csv command will write a text only file called outfile.csv to your working directory. You can then import it to Excel or other spreadsheet application. The columns are separated by commas (hence the ?csv)