Agarose gel electrophoresis
10 questions in this handout
Background
Agarose gel electrophoresis is a widely used method for separating DNA fragments based on size as they migrate through a porous agarose matrix under an electric field. During electrophoresis, smaller fragments move more quickly through the gel, creating a characteristic pattern of bands. After the run is complete, analysis is generally performed on a captured gel image, a process known as gel documentation, which allows visualization, measurement, and comparison of DNA band positions. This combination of separation and image-based analysis provides a reliable way to estimate fragment sizes and verify the outcomes of molecular biology experiments. We describe and provide guidance for gel analysis in the next page at Gel documentation along with a specific use-case with the free software imageJ.
Electrophoresis is a general term to describe a number of methods that rely on the movement and separation of charged macromolecules (proteins and nucleic acids) in an ionic solution in response to an electric field. It is a fundamental research tool in biological research, with more than 600K publications listed in PUBMED since the first publication in the 1920s.
Agarose is typically used to provide the matrix for separating DNA and RNA, polyacrylamide is used for proteins. Agarose can be used for large proteins. Blood proteins can be separated in an agarose gel, also known as serum protein electrophoresis (SPE). Agarose gel electrophoresis, alkaline pH 8.6, separates serum proteins into distinct fractions: albumin, alpha-1 (α1), alpha-2 (α2), beta-1 (β1), beta-2 (β2), and gamma (γ) globulins. Earliest work on serum proteins was done with starch gels (Smithies 1955), and these kinds of data were used by Richard Lewontin (1972), who reported that analyzed serum protein electrophoresis data and found most genetic variation is within populations (85%), not between them (only about 8%). This was a profound research paper — it’s finding undermined the biological basis for racial categories, showing there is no distinct genetic separation between races and that traditional notions of biological races are not supported by genetic evidence (Edge et al 2022).
Electrophoresis explained
The basic components of electrophoresis include the
- Electric current as driving force
- Sample to be separated by size and or charge (+/-)
- Support matrix (eg, agarose), the gel
- Buffer (e.g., Tris, tris(hydroxymethyl)aminomethane, with EDTA, ethylene diamine tetraacetic acid)
- Staining system (e.g., methylene blue, EtBr, SBYBR green)
Nucleic acids are negatively charged at biology-relevant pH, thus both RNA and DNA will migrate through a gel towards the positive (anode) electrode. The gel acts as a sieve, impeding the progress of larger molecules through the matrix. Thus, smaller molecules migrate faster than larger molecules through the gel. The rates by which the molecules travel are inversely related to their size.
Question 1: In running DNA, we say “Run to red!” Which end should the wells of the gel be located, at the anode or at the cathode?
To accurately determine molecular weights of unknown fragments, all samples should be run in parallel with a known standard or ladder. Agarose (a natural polymer) is used for relatively large DNA fragments, but does not resolve molecules that are similar in size; polyacrylamide (a synthetic polymer, its precursor, acrylamide, is a neurotoxin), is used to separate small DNA fragments because of its higher resolving power. For more information about electrophoresis, please see the numerous Wikipedia entries on the subject (wikipedia Electrophoresis; wikipedia Gel electrophoresis; wikipedia DNA electrophoresis), and the wonderful book Electrophoresis in practice, by Westermeier, now in it’s 5th edition (2016).
If you have never run a gel before, then try this Virtual Lab video and exercises from the good folks at Genetics Science Learning Center or the University of Utah. It is simplistic, but gives a good overview of DNA electrophoresis and analysis. Another easy to follow presentation is available at Cold Spring Harbor’s Dolan Learning Center.
Examples of use of gels in genetics lab
We will routinely use agarose gels to help us visualize runs of PCR products (amplicons). In particular, we will run many RAPD and VNTR or SSLP samples this semester. However, agarose is not appropriate for quantifying differences among the strains of flies for SSLP because agarose is only capable of discriminating among DNA fragments that differ by several hundred bases. By definition, we expect microsatellites to vary among individuals by a few bases at most. However, agarose gels are easy to make and run and very appropriate for checking to make sure that our DNA extraction and PCR protocol are capable of providing us with product.
In the case of SSLP gels, and assuming we have product, we will use agarose gels as preparative gels. We can run the gels, then cut the bands from the gels and save the product because, once we have established that we have product, we will proceed next time to denaturing polyacrylamide gels. Polyacrylamide gels are capable of discriminating among DNA fragments that may differ by no more than one base.
Components of electrophoresis system
Question 2: On the exam, you should be able to draw and correctly label the components of an electrophoresis apparatus.
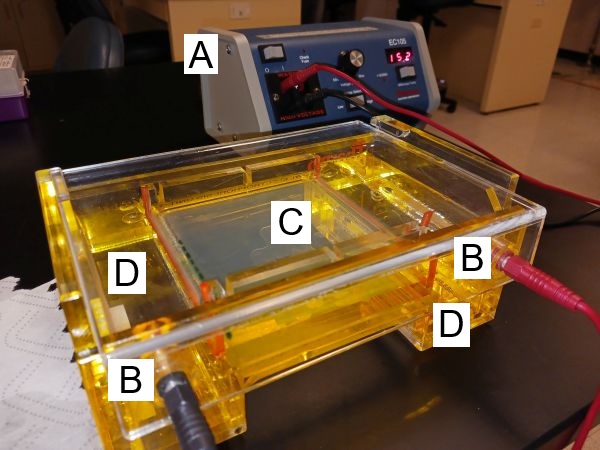
Figure 1. Thermo OWL B1 mini gel electrophoresis system in action (agarose gel).
Gel box and buffer tanks:
For running nucleic acid fragments, a horizontal or “submarine” gel box is used. Gel boxes are made of high impact resistant plastic. At either end you will see a single thin wire, the electrode, which runs to the bottom and across each buffer tank. The electrodes are connected to plugs that are used to connect the gel box to the power supply leads. Note that the box has a buffer tank at both ends of a raised platform. The gel is covered with the running buffer and rests on that platform.
Power supply:
The power supplies we use deliver DC — direct current — via the connected leads to the gel box. You can set the power supply to deliver constant volts (V) or constant current (I) in amps. Following Ohm’s law, V = IR, where R is the resistance, the “opposition” to the flow of current. The concentration of agarose and buffer, plus the gel thickness all determine the resistance — in principle, the higher the resistance, the greater separation of DNA fragments.
Selecting running voltage, recommendations for agarose gel electrophoresis is in the range of 5 – 10 volts per centimeter, the total distance between the electrodes. For the OWL B1 system, the distance between electrodes is 16 cm. That’s 80 to 160 volts for the B1 system. Higher voltage implies faster migration of fragments through the gel, but may distort the bands and, over longer runs, may lead to excess heat, requiring attention to cooling. Alternatively, lower voltage slows movements of fragments in the gel and would be preferred in cases where the goal is to distinguish large DNA fragments.
Question 3. During a gel electrophoresis run, you should monitor the current to confirm the buffer is in working order. If the volts are equal to 140 and the current reads 100 milliAmps, what is the resistance?
In general, the higher the volts the more “force” is generated and the faster the nucleic acid fragments will move in the gel, at the expense of release of lots of heat, which may melt the gel or cause other and potentially more hazardous consequences. As long as the running buffer is fresh, good connectivity will be achieved between the anode and cathode. During the run, monitor milliAmps: if the milliAmps drop, then the running buffer has lost much of the ions needed to maintain the current flow.
Buffers:
The running buffer, the volume of liquid in the electrophoresis box, is the same buffer used to make the gel, and at the same concentration (e.g., 1X TAE). The water used is distilled or deionized water, even ultrapure Type 1 water. Running buffer for DNA gels is either TAE (tris-acetate-EDTA), or TBE (tris-borate-EDTA), buffers are used to maintain pH and to provide ion support conductivity. For RNA gels, formaldehyde may be added to the gel or loading buffer, with the gel buffer system comprised of sodium acetate and MOPS, 3-(N-morpholino)propanesulfonic acid.
Question 4. What is significant about “ion support conductivity” in electrophoresis?
Tris (Wikipedia) keeps DNA deprotonated and soluble in water. EDTA (Wikipedia EDTA) is a chelating agent – it forms complexes with many divalent metal ions that that are required cofactors for enzymes. Thus, EDTA is also important in the storage of DNA or other nucleic acids.
The electrophoresis part is just electrolysis. What is the nature of the bubbles of gas in Figure 2? In Figure 3?
Figure 2. Bubbles at “red” buffer end.
Figure 3. Bubbles at “black” buffer end.
Question 5. Why are there twice as many bubbles at the “black” electrode than at the “red” electrode during agarose gel electrophoresis?
Question 6: So, under these conditions, is DNA an acid, a base, or neither?
Question 7. With respect to “accepting” or “releasing” H+ (hydrogen ions), what is an acid? What is a base.
Question 8: During an electrophoresis run, heat is inevitably generated. It is known that Tris is a poor buffer as temperature increases. Why is this an important consideration for running electrophoresis of DNA for more than two hours?
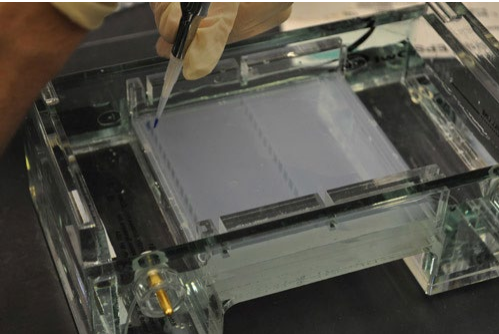
Figure 4. Loading DNA samples into the gel.
Loading buffer: a buffer that contains 25% v/v glycerol or sucrose or Ficoll plus a tracking dye (eg, bromophenol blue). The tracking dye allows progress of the electrophoresis run to be monitored without the need for visualizing the bands.
Question 9. What is the purpose of the glycerol (or sucrose or Ficoll) in the loading buffer?
We need to make visual the biological molecules moving in the gel. We “stain” the molecules. Many chemical agents have been found or developed to make DNA visible, one of the oldest known is ethidium bromide. EtBr: Ethidium bromide (Wikipedia EtBr) is useful for staining DNA and RNA, but is highly toxic and a mutagen. Under no circumstances should EtBr be used without safety precautions (glasses, gloves), and disposal must be conducted appropriately (see instructor and MSDS). EtBr binds to DNA bases, producing an orange color visible under UV illumination. EtBr intercalates (inserts) between the base pairs of double-stranded DNA. Under proper conditions, approximately one EtBr molecule is intercalated per 3 base pairs, regardless of the DNA sequence. EtBR may be added to the gel before loading the sample DNA, which permits visual monitoring of the band progress during electrophoresis, or it may be added after the gel has been run, thus eliminating impact on mobility of DNA that EtBr will likely have.
Some researchers prefer to add EtBr to the buffer or gel so that the bands can be viewed in real time; others prefer to add EtBr to the gel after a run has been completed. There are pros and cons to either choice. We will stain the gel afterwards; this cuts down on EtBr waste.
Question 10. What is the proper procedure for disposing of etbr waste after staining a gel?
A relatively nontoxic alternative to EtBr is methylene blue: also a useful, and nontoxic stain for DNA and RNA. Binding of the dye to DNA seems to be ionic, to the phosphate groups. Visualization of bands is also conducted under UV light. It is less sensitive then EtBr. A solution diluted to 0.02 – 0.04% in water is typical. If approximately 50 ng of DNA (or RNA) are used per lane and a procedure of staining for 1 hour is employed, desirable results are achieved. We do not use this dye because it requires significantly more DNA than we are likely to have in each band.
References and suggested reading
Brody, JR & SE Kern (2004) History and principles of conductive media for standard DNA electrophoresis. Analytical Biochemistry 333:1-13
Edge, M. D., Ramachandran, S., & Rosenberg, N. A. (2022). Celebrating 50 years since Lewontin’s apportionment of human diversity. Philosophical Transactions of the Royal Society B, 377(1852), 20200405.
Lewontin, R. (1972). The Apportionment of Human Diversity. Evolutionary Biology, 6, 381–398.
Sanderson, B. A., Araki, N., Lilley, J. L., Guerrero, G., & Lewis, L. K. (2014). Modification of gel architecture and TBE/TAE buffer composition to minimize heating during agarose gel electrophoresis. Analytical Biochemistry, 454:44–52.
Smithies, O. (1955). Zone electrophoresis in starch gels: group variations in the serum proteins of normal human adults. Biochemical Journal, 61(4), 629.
Westermeier, R 2005 Electrophoresis in practice, 4th ed. Wiley