Gel documentation
Four questions this handout
Background
Gel electrophoresis as a concept has been with us for some time. Since its introduction in the late 1950’s, there has literally been an explosion of techniques, improvements, and new approaches developed with electrophoresis as the unifying theme (e.g., see book by Westermeier). We provided a “how to” for agarose gel electrophoresis.
What remains true for all of the techniques are requirements for documentation of the results — gel documentation — as the necessary intermediate steps in any analysis. Basically, gel documentation involves detecting band positions and or quantifying amounts of DNA or protein in bands by intensity. This page is about identifying band position. Gel densitometry is described elsewhere.
Gel documentation implies use of staining dyes (or 32P or other radioisotopes for autoradiography), particularly fluorescence — light emitted when a molecule absorbs light energy at one wavelength then emits photons at a different wavelength — and chemiluminescence — light produced from a chemical reaction — to make the nucleic acid or protein samples visible, as well as use of a technique to visualize and store the patterns revealed in the gel. Thus, although techniques and approaches are numerous, certain key analytical steps are common.
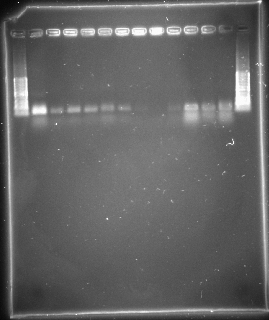
Figure 1. Ethidium bromide stained SSR from D. melanogaster isofemale strains 1.5% agarose gel. The first (left) and last (right) lanes contain the DNA standards with known fragment sizes (from 100 to 1000 base pairs); it’s also called the “ladder.” Note that the image is overexposed, and was not inverted — dark bands easier to see against light background.
Principles of Gel documentation
Gel documentation refers to the identification of bands in a gel. Gel densitometry refers to techniques to quantify by pixel counting the amount of a substance and will not be discussed here. In the present handout, we take you through basic procedures for extracting mobility data for
1. Identifying bands
2. Standardizing mobility data so that
- adjustments to gel imperfections are accomplished
- bands in different lanes may be compared
- bands evaluated from different gels may be compared.
3. Contrasting banding patterns among lanes of the gel.
4. Relating molecular weight standards to bands of samples run on the gel with unknown molecular size (semi-logarithmic Ferguson-style plots).
Note that molecular size can be taken as the molecular weight in atomic mass units or Daltons, or for DNA and other nucleic acids, size can refer to the number of base pairs (bp). Note that one DNA base pair is approximately equal to 660 Daltons (D). Thus, the human diploid genome size of 6.6 billion bp is equal to approximately 4.36 billion kiloDaltons (kD).
Bands to markers
Image from CDC.
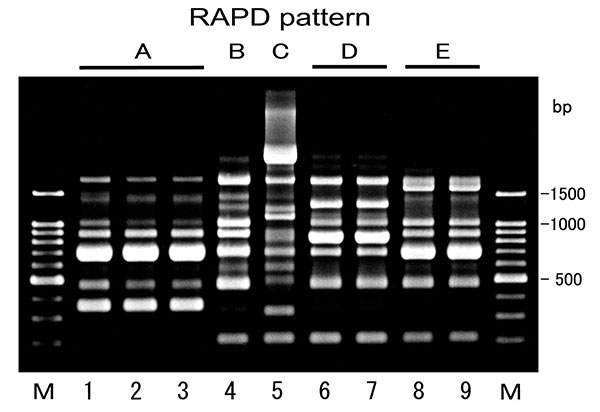
Figure 2. Example RAPD gel, CDC – Emerging Infectious Diseases, vol 10(1)..
In the gel image above, we see a number of bands distributed across the sample lanes 2 – 9 (with M containing the ladder: 1500, 1000, 900, 800, 700, 600, 500, 400, 300, 200 –100 band not visible).
A lot of bands. But how many markers?
Think of a marker as a row you can draw across the gel. We define a marker then as any band(s) found on a row. Counting the number of rows equals the number of distinct markers. I see ten rows. In the image below I’ve marked the rows with red lines.
Ladders and migration of fragments in a gel
After completion of the gel run, identification of the bands and relating bands to some measure of size is a standard analytical step in gel documentation. After identifying the bands in the gel, an essential first step is to determine the distance each band has traveled relative to the dye front.

where BAND = Band’s Actual Near-to-far Distance, the distance between sample well and gel band and FRONT = Final Reach Of Navigating Tracker, which reflects that the tracking dye front travels the farthest toward the “front” of the gel.
Note 1: Like BAND and FRONT? Made it up with assistance from ChatGPT.
The relative migration (rf) of bands in a gel is a result not only of the size of the fragment but also of other factors including gel concentration, buffer strength, temperature, and volt hours applied. Therefore, one cannot simply measure the distance a band has moved and compare it to the distance moved by a sample in another gel; even if the rf values are the same, that does not mean the fragments are the same size. But, with careful technique and attention to details, one can minimize gel to gel variability, hence increasing the repeatability and thus reproducibility of rf values.
I’ve provided a short slide show that presents how to get rf values from a gel and in turn, how to use rf values. Click here for Slides: Gel rf values.
Troubleshooting rf calculations
Question 1. What if you can’t see the dye front? Or the wells? How do you calculate rf?
Answer. When you are working with your own images, this isn’t likely a problem, but for the image above, it was cropped and neither the dye front nor the wells are visible. To calculate rf, take the image edge at top as the wells and the image bottom as the dye front. Here’s an image of a gel with rf values calculated by the proper identification of wells and dye front (red lines) and then again from where a cropped image of the gel (yellow lines).
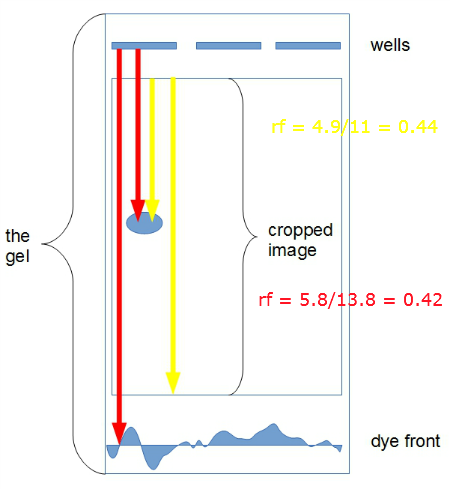
Figure 3. Schematic for rf calculation
The distances are in cm. For the rf values calculated with wells and dye front visible, rf was 0.42; for the cropped image, rf was 0.44. Close enough for what we are doing. And, this approach would be OK for publication, too, because the rf values are relative, so this estimate applied to all bands will not yield incorrect rf values for the gel. Thus, this would be an OK solution for a gel as all rf values calculated on the gel will have the same error. This would not be a good solution for obvious reasons if the goal ultimately would be to compare other gels.
Ferguson-style plots
The Ferguson plot is the semi-logarithmic plot of electrophoretic mobility against gel concentration. The procedure then would be to relate the movement of the size standards in the gel relative to the dye front (ie, calculate rf values for each known standard band), then use this information to relate rf values for the unknowns to the distance moved by known size standards. If a size standard is run in every gel, then considerations of gel to gel variability of running conditions is not a large issue.
Molecular weight is an inherent property of the DNA fragment that, once determined, properly describes that variant.The electrophoretic mobility of a protein or nucleic acid in a gel is equivalent to its molecular weight.
We can use a Ferguson-style graph as a calibration curve to help identify size of unknown DNA/RNA fragments (Fig 4A and B). Instead of gel concentration, size in bp of known DNA fragments is plotted against rf movement distance of the same DNA fragments. We can determine the size of the DNA fragments or proteins if we generate a standard curve from known molecular weight markers. This is accomplished by plotting their rf values against the log of their size (MW or base pairs). Calculate a linear regression equation and predict the unknowns.
| A
|
B
|
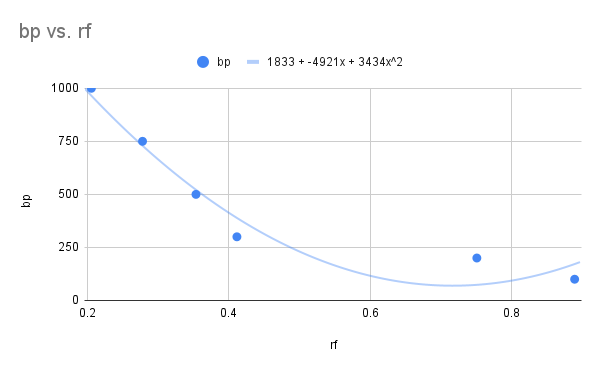
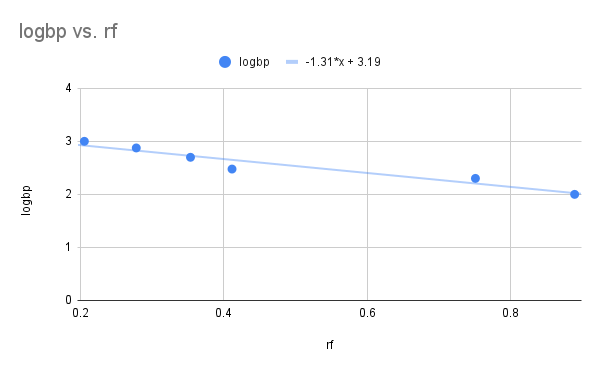
Figure 4. Ferguson-style plots, mobility of DNA fragments of known size (base pairs, bp) in agarose gel. A: raw data, polynomial equation fit bp = 1833 – 4921(rf) + 3434(rf2); B: semi-log (log10 BP), linear equation log10(BP) = 3.19 -1.31(rf).
Question 2. For an unknown DNA sample, a band has migrated in the gel to an rf = 0.6. How many base pairs is this band?
Solution.

Get the inverse log

I’ve provided a short slide show that presents how to get rf values from a gel and in turn, how to use rf values and known ladder valued to make a Ferguson plot.
Question 3. Construct a Ferguson-style plot of standard DNA fragments generated by the treatment of bacteriophage lambda DNA with HindIII from Figure 2A of Miura et al Nagoya Medical Journal 43(1) 1-6, 1999). Table 1 provides data for you to answer the question.
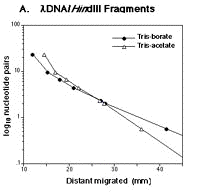
Figure 5. Data were extracted from the image by ImageJ with the Figure_calibration plugin. If you are interested, here’s a simple description of how to do this.
Table 1. Extracted data from Figure 5.
| Distance (mm) | base pairs (BP) | log10(BP) |
| 12.1 | 78.6 | 1.895423 |
| 15.4 | 65.5 | 1.816241 |
| 17.9 | 60.0 | 1.778151 |
| 21.2 | 53.9 | 1.731589 |
| 27.2 | 44.8 | 1.651278 |
| 28.0 | 43.0 | 1.633468 |
| 41.5 | 24.4 | 1.387390 |
Hint: you can use Microsoft Excel or Google Sheets for this if you wish. Click here for help.
Question 4: Both gel densitometry and gel documentation may be used to generate calibration curves. If rf values are used (i.e., documentation) values are used, what is this a calibration of?
Protocols for gel documentation
After the gel has run to completion, and after staining the gel, any imaging system can be used to capture the gel. For DNA dyes that require UV illumination we would use the Bio-Rad Geldoc Xr or Bio-Rad GelDoc Go located in the Instrument Core Facility.
Software and instructions to carry out gel documentation
Please note — you are not required to use this software! For single use, and for the gels we are working with it, is much easier to do the analyses by hand with a ruler. However, this kind of software is routinely used by research labs for work with more complicated images so I am presenting this tool in that spirit.
An online option
An alternative is to use an online tool at https://eleif.net/photo_measure.html.
GelAnalyzer
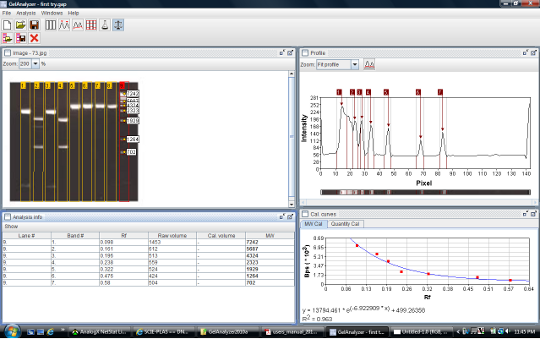
Figure 6. Screenshot of GelAnalyzer.
GelAnalyzer, an Open Source java program
http://www.gelanalyzer.com/?i=1
Download program and user manual (pdf)
- New Analysis
- Select image type
- Select Lanes mode
- Define lane detection ROI
- Detect lanes
- Detect bands
- Add bands manually
- Add MW values
Question 5. What does ROI stand for in the context of this program?
Question 6. Using the sample gel above (click here), and the instructions for GelAnalyzer2010, obtain the fragment size of the bright band in lane 2. The DNA ladder is in lane 1 and lane 14.
ImageJ
For general help with imageJ, see Help with imageJ.
Two short videos, no narration, showing how to run gel analysis on ImageJ.
and
/MD