How to read a phylogeny
In its most basic form, evolution is simply genetic change over time (generations). The processes of evolution that generate differences begin with mutation (inherited change of DNA sequence) and the fate over time of that mutation. The change observed in an individual may increase (the individual leaves lots of offspring), or decrease (the individual has few or no offspring). If the mutation itself contributes somehow to the individual having more (or fewer) offspring, then this represents change because of natural selection and the new mutation would increase (decrease) in the population. On the other hand, if the new mutation contributes not at all to whether or not the individual has offspring (the change is “neutral with respect to fitness”), then whether the new copy increases or decreases in the population over time is simply the result of chance (called genetic drift). In constructing phylogenies, for a variety of reasons, we prefer to use genetic changes that are neutral or nearly so with respect to fitness (fitness is very loosely defined as the number of offspring an individual leaves to the next generation).
Despite their importance in biology, you will have received little instructions to date about how to construct a phylogenetic hypothesis. Fortunately, there is a wealth of advice based on more than 40 years of research on the art and science of phylogenetics. For a basic introduction, see Hall 2011; for an advanced and complete work, see Felsenstein 2003. While you are unlikely to have spent time learning about the pros and cons of phenteic vs cladistic character sets, or the problems of clustering methods like neighbor joining algorithm for phylogenetic reconstruction, the basics of how to read a phylogeny, however, should be familiar to you by now from Introductory Biology Lab.
A phylogeny network, or “tree,” is a representation of “who is related to whom;” it is the study of evolutionary relatedness among groups of organisms, or Darwin’s descent component of his “descent with modification” definition for evolution. You may already be familiar with the foundational argument and justification for this type of network to show relationships. It is simply the extension of the basic concept of a family tree to one among species. Brothers, sisters, parents, aunts, uncles, cousins, grandparents, great uncles, etc. — we show this as a pedigree or family tree. One way to think about evolution is that it is inherently a branching process (cladogenesis). Think of the phylogenetic tree as an extended pedigree, from individual organism to their families, to their more distant relatives, and so on, back to common ancestors. An individual is at the tip of the branch, connected to other individuals by membership in families, with families connected to other families by membership in populations, and so on to the level of species, and to even higher taxonomic levels. Connections between branches are called nodes. One should not interpret the species extended from lineages that diverged before other taxa as the ancestors of those that came later; rarely, if ever do we have direct evidence for the claim that species A was the direct ancestor of species B
Ever since the first drawing by Charles Darwin (fig.1), a branching tree diagram has come to represent shared ancestry, the descent with modification.
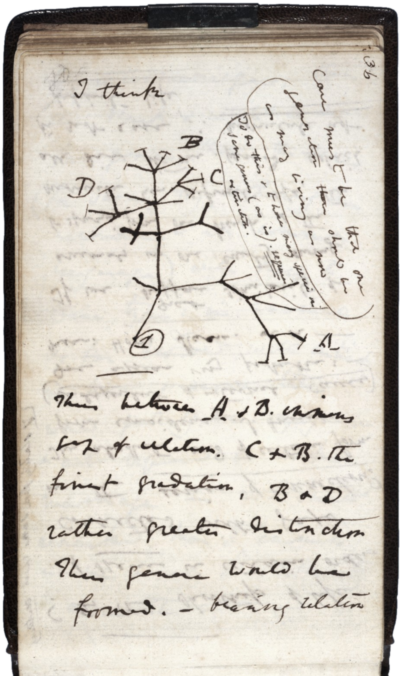
Figure 1. Charles Darwin’s “I think” phylogenetic tree from his notebook, dated 1837. Image By Charles Darwin – [1], Public Domain, https://commons.wikimedia.org/w/index.php?curid=36638808.
Figure 2 shows a “tree” linking five taxa. If the groups are families of humans, then we would interpret the branching order in terms of relationships. B and C are related to each other, D and E are related to each other, and both B,C and D,E are more closely related to each other than they are to family A. If this is a tree of species, then we would say that B,C shared a common ancestor more recently and D,E shared a recent common ancestor, and that the two groups (B,C and D,E) shared a common ancestor recently in contrast to their genetic relationship to A. This extension of geneology of individuals to geneology of species is a central concept in evolutionary biology.
Some terminology. A monophyletic clade consists of an ancestral species and all its descendants. For example, Mammals are considered to be a good example of a monophyletic group as there are no named species of what we would call mammals that are not part of the group. In contrast, Reptiles are not considered a monophyletic group because one descendant group, birds, are generally not included in taxonomic groupings. Reptiles are an example of a paraphyletic clade, a monophyletic group from which one or more descendant clades is not included but instead is listed as a separate group.
Question 1. Define phylogenetic “outgroup.” From tree in Figure 2, identify which taxon among the set {A,B,C,D,E) may be construed to be the outgroup to the ingroup.
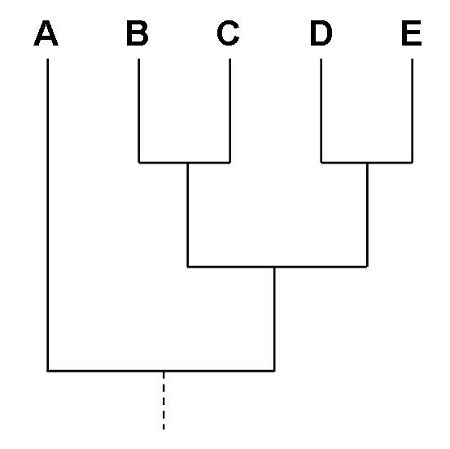
Figure 2. Hypothetical tree, a cladogram, of five taxa, A – E.
Question 2. Among the B, C, D, and E group, identify a paraphyletic taxa (i.e., lump together 3 species and identify the 4th as paraphyletic).
Question 3. On the tree in Figure 1, draw “F” as a new outgroup so that all other species are in a monophyletic clade.
Trees as hypotheses of Phylogenies
For RAPDs and RFLPs, once bands have been revealed gel, the simplest setup is to provide a table (matrix) and for each sample, score presence absence of a band, repeated for each taxa. Once we have the matrix of the number of shared markers and the markers (alleles and or genes) between our samples, we next turn to the computer and the vast array of bioinformatic tools available to turn the table of differences (or similarities) in markers into a phylogeny – represented as a tree diagram to represent branching order, or cladogram, like the one in Figure 2. (If the amount of character change between taxa is also represented (i.e., branch lengths), then the tree is referred to as a phylogram.) The matrix would be converted to distances and then the distances represented by a clustering algorithm to yield a tree graphic better known as a phylogenetic tree. Distance methods are only one kind of approach to construction of phylogenies and are actually not the preferred way (Pavlopoulos et al 2010) — most molecular evolutionary trees are character-change based and not distance based, and are constructed by Bayesian or Maximum likelihood methods.
How to interpret parts of the tree
In general, the horizontal spread of the drawn tree is done for convenience, it has no meaning. In the case of the cladogram in Figure 2, the branch lengths or vertical spread also have no meaning. If however a distance measure is used, the length of the branches can be used to convey the amount of difference or divergence between each of the nodes and branch tips. Branch lengths can represent divergence time (e.g., how long ago two species shared a common ancestor), but more generally the branch lengths are proportionate to the amount of character change between the taxa. If indeed time is represented by branch lengths, then additional assumptions must be made to provide actual time (e.g., millions of years).
Many forms of biological information can be used to construct phylogenies: morphology, physiology, behavior, etc. In Genetics and Genomics labs we will use either genetic markers and presence/absence, or sequence comparisons as our data for phylogeny construction.
References and resources
Felsenstein, J. (2003) Inferring phylogenies, 2nd ed. Sinauer Associates, Sunderland, MA.
Hall, B. G. (2011) Phylogenetic trees made easy: A how to manual, 4th ed. Sinauer Associates, Sunderland, MA.
Pavlopoulos, G. A., Soldatos, T. G., Barbosa-Silva, A., Schneider, R. (2010) A reference guide for tree analysis and visualization. BioData Mining 3:1 (linkLinks to an external site.)
/MD