RGD OLGA Example
Lots of websites now provide online tools for working in Systems Biology. This is just one example, the Rat Genome Database at https://rgd.mcw.edu/
As you can imagine, lots of genetic information about lab rats are available, but also links to databases for humans, mice, dogs, and a few others.
Assuming that you have a list of genes and you wish to make connections among them, the OLGA tool is useful for this. From the RGD homepage find OLGA Object List Generator & Analyzer.
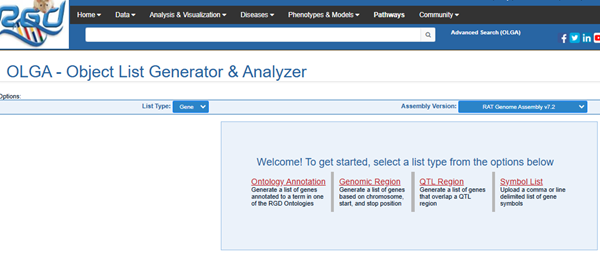
Figure 1. Screenshot of OLGA page at https://rgd.mcw.edu/rgdweb/generator/list.html
Step 1. Select genome via drop down list Assembly version: the default is rat genome (Fig 2).
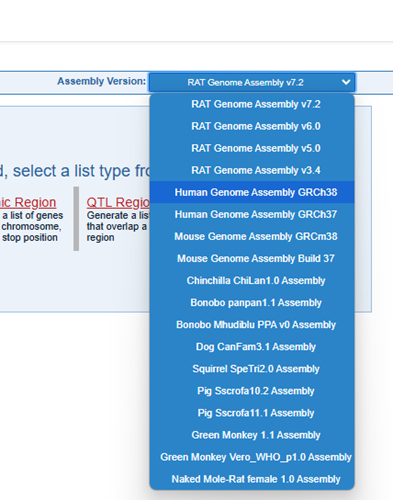
Figure 2. Screenshot OLGA, select genome from drop down list at https://rgd.mcw.edu/rgdweb/generator/list.html
Step 2. Select Symbol list (Fig 1).
Step 3. Copy gene list to text box (Fig 3). Press Continue button the list was provided to the text box.
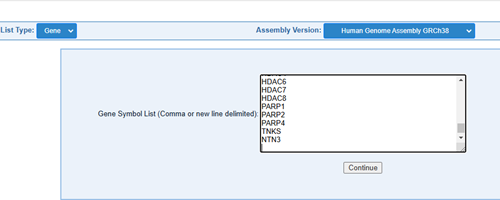
Figure 3. Screenshot text box, copy gene list at https://rgd.mcw.edu/rgdweb/generator/list.html
Step 4. Click on Analyze Result Set link (Fig 4), which will bring up a menu of options (Fig 5).
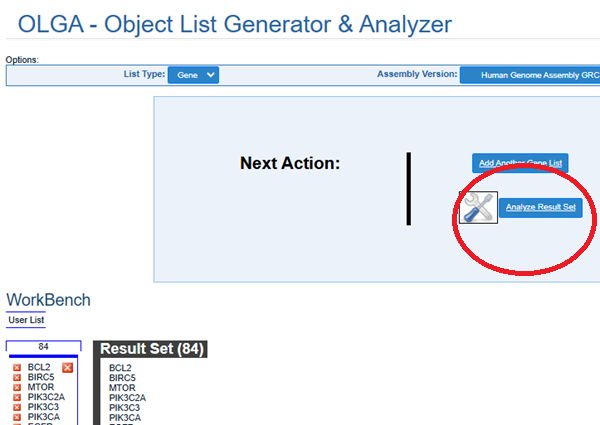
Figure 4. Screenshot OLGA with loaded gene list, ready for analysis.
Step 5. Select analysis. For example, if the goal is to obtain a network dataset, then select InterViewer (highlighted by red star, Fig 5). If comparing other gene lists, go back to OLGA list generator (Fig 4) and click on the Add Another Gene List. Then, select OLGA (Gene List Generator, Fig 5) to specify how to compare the gene lists.
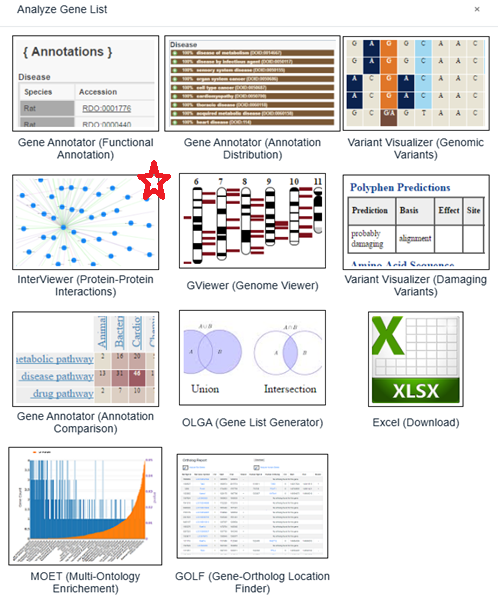
Figure 5. Screenshot, OLGA analysis options. For network, select Interviewer (labeled with red star in the image).
Step 6. If fewer than 500 nodes, a visual display will appear (Fig 6). From this page a number of explorations can be accomplished. Since this was a rat gene list, at minimum I select only rat from the species list (midlevel, right-side of screen).
If more than 500 connections, the visual screen will not load. Go to step 9.
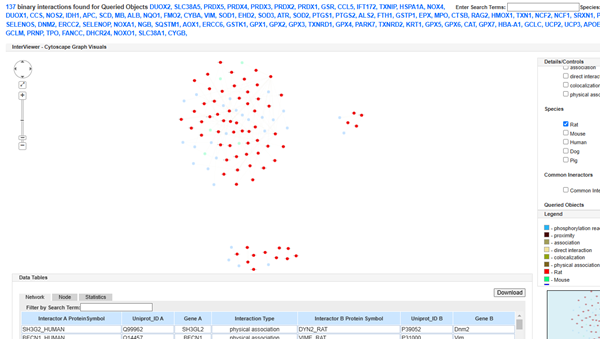
Figure 6. OLGA results page with network visuals.
Step 7. Select Download button and save the network table (.txt) to working folder. The default filename is interactions.txt.
Step 8. Import the file as network file in Cytoscape.
Step 9. One possible result, your list points to too many nodes and or interactions. If not too large, the network table will still be generated, and available for download (Fig 7). Download the .txt file and go to Step 7. If the list generates more than several thousand connections, then no results may be reported. See Step 10.
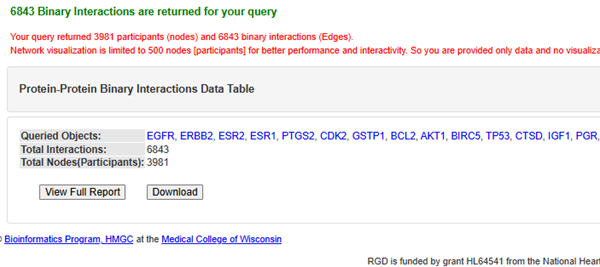
Figure 7. Screenshot, OLGA warning message. Download available.
Note: This request was based on a list of just 15 genes! IT shouldn’t surprise, the list contains genes associates with drug targets of breast cancer (Fig 8).
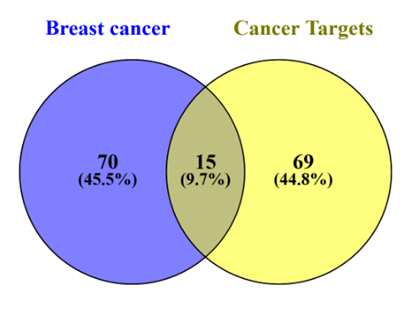
Figure 8. Venn diagram overlap between two focused PCR arrays (Breast cancer, Cancer drug targets) from Qiagen.
Step 10. If you receive the following OLGA error message: Your query returns 17789 interactions. Please reduce your query list to return less than 10000 interactions — then do as they ask😁. This isn’t the site to generate that large of a dataset.
/MD