Example – Student paper
Return to Lab report write-up
For simulated student papers, both good and poor, see page at Simulated student paper examples.
Mass Versus Stage Effects on Oxygen Consumption of Rana pipiens Larvae During Spontaneous Metamorphosis
by Anonymous student
Submitted February 2014
Abstract
Rates of minimal oxygen uptake (VO2), measured with an oxygen sensitive electrode, were determined using the general allometric expression VO2 = AMb. Using partial correlation coefficients we demonstrated that VO2 variance was due to changes in larval mass independent of developmental stage.
Introduction
Minimal, or resting oxygen consumption rates (VO2), have been determined for many anuran species during spontaneous metamorphosis. Deviations from established VO2 values may reflect the effects of ecological, physiological, and morphological factors (Feder 1981). Boell proposed that VO2 variation in anuran larvae was due to the intense metabolic activity accompanying growth and differentiation (Boell 1948). For free-swimming larvae mass-specific VO2 is thought to remain constant or decline, depending on the species, throughout the remainder of the metamorphic period despite the correlation of substantial growth and differentiation (Feder 1982). Measurements of VO2 for amphibian larvae have generally been used to distinguish body mass and developmental stage effects on the pattern of VO2 variation. Failure to provide appropriate controls and inadequate statistical designs have frustrated clear, absolute interpretations (Feder 1982). While the literature describing VO2 values for amphibian larvae is extensive, the discrepancy between the influence of mass and/or developmental stage has yet to be resolved (Beck and Congdon 2003, Vladimirova et al 2012).
Feder found that larvae of Rana berlandieri and Hymenochirus boettgeri resemble most other animals in their VO2-M relationship; that is, VO2 rates, measured in volumes O2 STP hr-1, scale with body mass according to the equation VO2 = AMb denotes body mass, A and b are constants, and 0 < b < 1 (Feder 1982). Therefore, an increase in body mass correlates with a decrease in mass correlates with a decrease in mass-specific VO2. Multivariant analyses demonstrated that developmental stage had little or no effect on VO2 throughout metamorphosis, while changes in body mass correlated strongly with VO2 variation during metamorphosis (Feder 1982).
Our study sought to extend Feder’s work to free-swimming larvae of the anuran species Rana pipiens. Using a standard allometric equation (Schmidt-Nielsen 1977), body mass and developmental stage effects on VO2 variation were examined during spontaneous metamorphosis. Because larval body mass during growth is variable among individuals independent of developmental stage, we expected to verify Feder’s findings that changes in VO2 during metamorphosis were due primarily to variation in body mass as opposed to developmental stage. Metamorphosis will hereafter refer to all manifest changes during the transformation of tadpole to metamorphic climax, defined as stage number 45 (Gosner 1960).
Materials and methods
Care of animals. Rana pipiens were induced to spawn in the laboratory and the larvae were reared in aerated tap water. Larvae were fed a commercial tropical fish food twice daily (Hartz). Photoperiod was roughly maintained at 12:12. Water temperatures ranged with room temperature, from 20 to 24 °C, throughout the period of study.
VO2 measurements: We measured VO2 with a YSI meter, model 51B, and a YSI oxygen – temperature probe (Yellow Spring Instruments Co., Yellow Springs, Ohio). We equipped a mason jar (volume 885 ml), with a magnetic stir bar housed in a slotted Petri dish glued to the bottom of the jar. Water samples from the aquarium were used and petroleum jelly served as a sealant once the vessel had been fitted with the probe.
Oxygen consumption was recorded in ppm and VO2 values (ml O2 STP · hr-1), were determined for n=13 larvae, stages 31-45 (protocol established by Gosner 1960). Mass-specific VO2 was determined with the following relationship: ml O2 STP · (hr · M)-1, where M is larval wet mass in mg. Statistical methods: Chi-squared analysis, correlation coefficients, and partial correlation coefficients were used to determine mass versus developmental stage effects on VO2 variation (Freund 1984).
Results
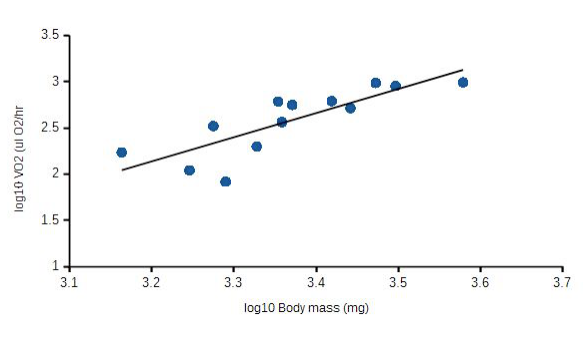
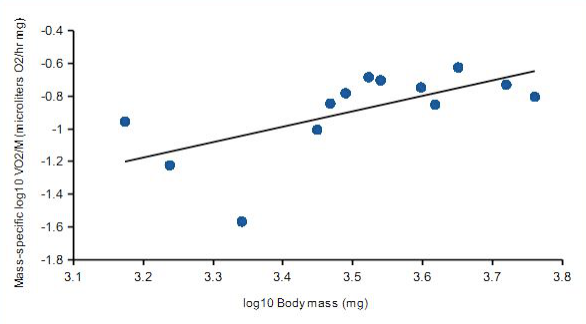
When plotted against log10 body mass, increases in log10 VO2 were directly proportional to larval wet mass (Fig. 1). Body mass was a good predictor for increasing VO2 (correlation coefficient, r = 0.79). Clearly, a significant amount of increased oxygen consumption relates to increased mass (62%). And as Figure 2 demonstrates, mass-specific VO2 decreases with increasing mass. Values for A and b, which are likely to be species-specific, reflecting intrinsic physiological and ecological differences, were A = 1.03 and b =1.33.
[Insert Figure 1 here]
Figure 1. Effects of body mass, M, on rates of oxygen uptake VO2 for Rana pipiens larvae. VO2 = AMb, where A = 1.03 and b = 1.33. Coefficient of correlation, r = 0.79.
[Insert Figure 2 here]
Figure 2. Mass-specific VO2, relating increased size to decreased VO2; also referred to as scaler effect.
If developmental stage also correlated with increased VO2, then it is possible that the heavier larvae were represented in the more advanced developmental stages. In Table 1, the 13 larvae are grouped based on their developmental stage, where group I reflects larvae of stages 35-39 and group II is represented by larvae of stages greater than 39. Based on this sampling size, a tadpole of, for example, 3.6 grams was as likely to be found in group I as in group II (p < 0.05).
[Insert Table 1 here]
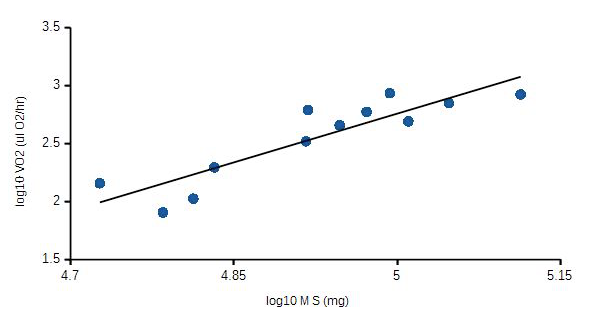
Using developmental stage as a predictor, very little, if any VO2 variation can be explained by developmental stage (r = 0.085). However, when mass and developmental stage were considered together, 88% of the variation in VO2 was related to these two predictors (Fig. 3). Partial correlation analysis removes either M or 5 effects on VO2 (Table 2); body mass was a better Predictor of VO2 variation than developmental stage (positive versus negative correlation, respectively).
[Insert Figure 3 here]
Figure 3. Mass/developmental stage-specific VO2. The effects of body mass and developmental stage combined as a predictor of VO2 variation. Correlation coefficient, r = 0.94.
[Insert Table 2 here]
Discussion
Table 3 summarizes our results on mass and/or stage effects on oxygen consumption for Rana pipiens larvae. The general trend of heavier animals exhibiting lower mass-specific VO2 holds for this species, therefore scalar effects are relevant to this larval anuran.
[insert Table 3 here]
As a predictor of VO2 body mass accounted for a significant proportion of VO2 variation. That mass and stage collectively accounted for more VO2 variation than mass alone needs to be explored further. Our small sampling size may account for the increased predictor value obtained by considering mass and stage together, since it appears that larval mass and developmental stage is not necessarily linked; Since developmental stage alone cannot be used to predict VO2 (r = 0.085); such intrinsic factors as increased respiratory enzymes may account for this increased predictor value.
Throughout metamorphosis, there is a general trend towards increased size. Metamorphic climax typically is correlated with decreased body weight. If scalar effects are the primary factor responsible for the changes in VO2, we would expect an increase in VO2 at metamorphic climax, or stage 45. A previous study reported a significant decline in mass-specific VO2 for Bufo boreas at the 45th stage (Sivula et al 1972). Feder points out that their plot is actually curvilinear, suggesting that a polynomial regression would be more appropriate than a least-square analysis (Feder 1982). If polynomial regressions are used on their data, the values for VO2 increase as predicted by the scalar hypothesis (Feder 1982). He concluded that VO2 values for later stages were influenced by scalar considerations. We could neither confirm nor refute these findings for R. pipiens due to an inadequate number of late-stage larvae. In addition to these statistical considerations, it may be appropriate to incorporate a longitudinal approach, following individuals to stage 45, in order to truly assess the effects of metabolic climax and body mass on VO2 variation.
Xenopus laevis larvae seem to represent an exception to the scalar hypothesis and may provide insight on the problems of “gill-to-lung aeration adaptations” (Feder 1982). Feder reported that mass-specific VO2 at metamorphic climax for this species was, in fact, lower than that predicted under the scalar hypothesis. Several factors have been proposed to cause similar declines in VO2 thyroid hormone production, growth, or morphological changes are each associated with increased VO2 (Boell 1948; Frieden 1967; Feder 1982). Decreased mass-specific VO2 near stage 45 may be related to diminished levels of either one or a combination of the above factors. Based on the statistical approach of Feder, it is unclear whether or not previous studies actually demonstrated decreased mass-specific VO2 at stage 45; more work is in order to determine whether scalar effects of body mass apply to metabolic climax VO2 or if the profound changes associated at stage 45 will serve to be an appropriate predictor.
One important consideration not discussed previously is the animal’s behavior during development and its effect on VO2. Feder (1982) reported that Xenopus larvae swim in mid-water while stage 45 larvae rest on the bottom and feed only periodically. Stage 45 larvae, if they feed at all, are microphagus while larvae of earlier stages are more macrophagus. Reduced physical activity and starvation-like conditions may account for the reported low VO2 at Stage 45 (Feder 1981). Therefore. careful controls designed to account for the trophic state and activity levels must be employed. Some final comments regarding our methodology; while it is true that we were able to extend most of Feder’s results to Rana pipiens, our values for A and b differ significantly from the values reported by Feder for a Rana species: A=2.5 and b=0.878 (Feder 1982). Factors likely to have influenced our results but not accounted for are microbial VO2, pCO2, and larval activity during measurements. Of these three, it is likely that the first had the most significant influence; a sample of the aquarium water without the larva showed 4 ppm oxygen consumption over a similar time course. Another contributing factor may have been ineffective mixing of O2 saturated and depleted water. Dye introduced to the vessel with and without stirring diffused throughout at a similar rate (~20sec). Assuming that the dye mimicked the diffusion rate of dissolved O2, this would have led to transitional regions of depleted O2 subject to mixing during transient bursts of activity.
Acknowledgements
The author thanks A. Gauger and V. Schweickert for the Rana pipiens larvae. The author also wishes to thank V. Schweickert for help with data collection.
Literature Cited
Beck, Christopher W., and Justin D. Congdon. 2003. Energetics of metamorphic climax in the southern toad (Bufo terrestris). Oecologia 137: 344-351.
Boell, E.J. 1948. Biochemical differentiation during amphibian development. Ann. NY Acad. Sci. 49:773-800.
Feder, M.E. 1981. Effect of body size, trophic state, time of day, and experimental stress on oxygen consumption of anuran larvae: an experimental assessment of the literature. Comp. Biochem. Physiol. 70A:497-508.
Feder, M.E. 1982. Effect of developmental stage and body size on oxygen consumption of anuran larvae: a reappraisal. J. Exp. Zool. 220:33-42.
Freund, J.E. 1984. Modern Elementary Statistics, 6th edition. Prentice-Hall, Inc., New Jersey, pp 354, 442, & 454.
Frieden, E. 1967. Thyroid hormones and the biochemistry of amphibian metamorphosis. Rec. Progr. Horm. Res. 23:139-186.
Schmidt-Nie1sen, K. 1977. Problems of scaling: locomotion and physiological correlates. In: Scale Effects in Animal Locomotion, ed T.J. Pedley, Academic Press. NY, pp 1-21.
Gosner, K.L. 1960. A simplified table for staging anuran embryos and larvae with notes on identification. Herpetologica 16:183-190.
Sivula, J.C., Mix, M.C., and McKenzie, D.S. 1972. Oxygen consumption of Bufo boreas boreas tadpoles during various developmental stages of metamorphosis. Herpetologica 28:309-313.
Vladimirova, I. G., S. Yu Kleimenov, and T. A. Alekseeva. 2012. Dynamics of body mass and oxygen consumption in the ontogeny of the Spanish ribbed newt (Pleurodeles waltl): 2. Larval stage. Biology Bulletin 39: 10-14.
Table 1: Effects of wet body mass, and Gosner (1960) developmental stage, S, on oxygen consumption VO2.
|
Stage |
n |
Range Mass |
Average Mass |
A |
b |
RANGE VO2 |
Average VO2 |
Expected VO2 |
X2 |
|
S < 35 |
1 |
– |
2.33 |
– |
– |
200 |
– |
– |
|
|
I 35 < S <39 |
5 |
2.2 – 4.8 |
3.31 |
1.05 |
1.25 |
364 – 960 |
602 |
672 |
7.3* |
|
II S > 39 |
7 |
1.3 – 5.9 |
2.57 |
1.01 |
1.44 |
154 – 364 |
407 |
480 |
13* |
* Average and expected VO2 not significant (chi-squared X2, p < 0.05). Expected VO2 based on Mass = 3.6 grams, A = 1.03, and b = 1.33. Mass in units x 1000 mg; VO2 in units mL O2 STP · hr-1).
Table 2. Partial correlation coefficients for log10 VO2, V, log10 Mass, M, and Gosner (1960) developmental stage, S.
|
Interaction |
Correlation coefficient (r) |
|
VM · S |
2.1 |
|
VS · M |
-3.2 |
|
MS |
0.94 |
Table 3. Summary of Mass versus Stage effects on VO2 variation.
|
Interaction |
Correlation |
|
VM-1 |
(+) |
|
S |
(-) |
|
M |
(+) |
|
VM-1· S |
(+) |
|
VS · M |
(-) |
V = log10 VO2; M = log10 Mass; S = Gosner (1960) developmental stage.
/MD